
The 6-Stage Onboarding Health Score: A Diagnostic for SaaS Customer Onboarding
A self-administrable framework for finding exactly where your onboarding breaks — and what the score means for retention.
Ask the head of customer success at a growing SaaS company what is wrong with their onboarding, and the answer is almost always one of four sentences. We don't have enough implementation managers. Every customer is too different to standardize. Sales over-promises and we clean it up. Our product is just complicated.
Every one of those is true. None of them is the actual problem.
The actual problem is structural. Onboarding is the only process in a SaaS company where every functional discipline meets the customer at the same time. Sales hands over a relationship. Product needs the account configured correctly to demonstrate value. Customer Success owns the relationship but not the technical setup. Engineering owns the data migration but never speaks to the customer. Support inherits whatever is still broken at the end. And in the middle sits a CSM — hired for warmth and empathy — steering a multi-week, cross-functional project with no project manager, no system of record, and no clear authority to make decisions.
That is not a performance problem. Nobody is doing their job badly. The job, as it actually exists, has never been defined as a discipline.
You cannot fix an undefined discipline by working harder at it. You have to define it first. This post is a tool for doing that: a six-stage diagnostic you can run on your own onboarding operation this week, score honestly, and use to find the specific stage where retention is leaking.
Why onboarding gets worse as you scale
Before the framework, one observation that reframes the whole problem: onboarding does not get easier as a SaaS company grows. It gets harder, and it does so predictably.
At 10–50 customers, onboarding is run by founders or early CSMs who care intensely about every account. Quality is high because attention is high. The structural flaw — that nothing is written down — is completely invisible, because individual effort is covering for it.
At 50–100, the first CSM hires arrive. They inherit a process that was never documented because it never needed to be, and they learn it by watching and improvising. Quality drops. Fast growth masks the drop.
At 100–300, onboarding gets a name and a team. SOPs get drafted. But nothing is enforced, because nobody owns enforcement, so every CSM still runs it their own way. Quality is now openly variable — some customers get excellent onboarding, some get almost none — and the variance stays invisible until the renewal forecast arrives.
At 300–500, the operation either gets rebuilt deliberately or it quietly starts costing money nobody can trace. This is the point the CFO describes as "our CAC is rising and we don't know why," and the CS leader describes as "we keep hiring but onboarding still feels broken." They are describing the same thing.
Onboarding did not get worse because the team got worse. It got worse because individual effort stopped being able to substitute for a system. The framework below is how you build the system.
The six stages
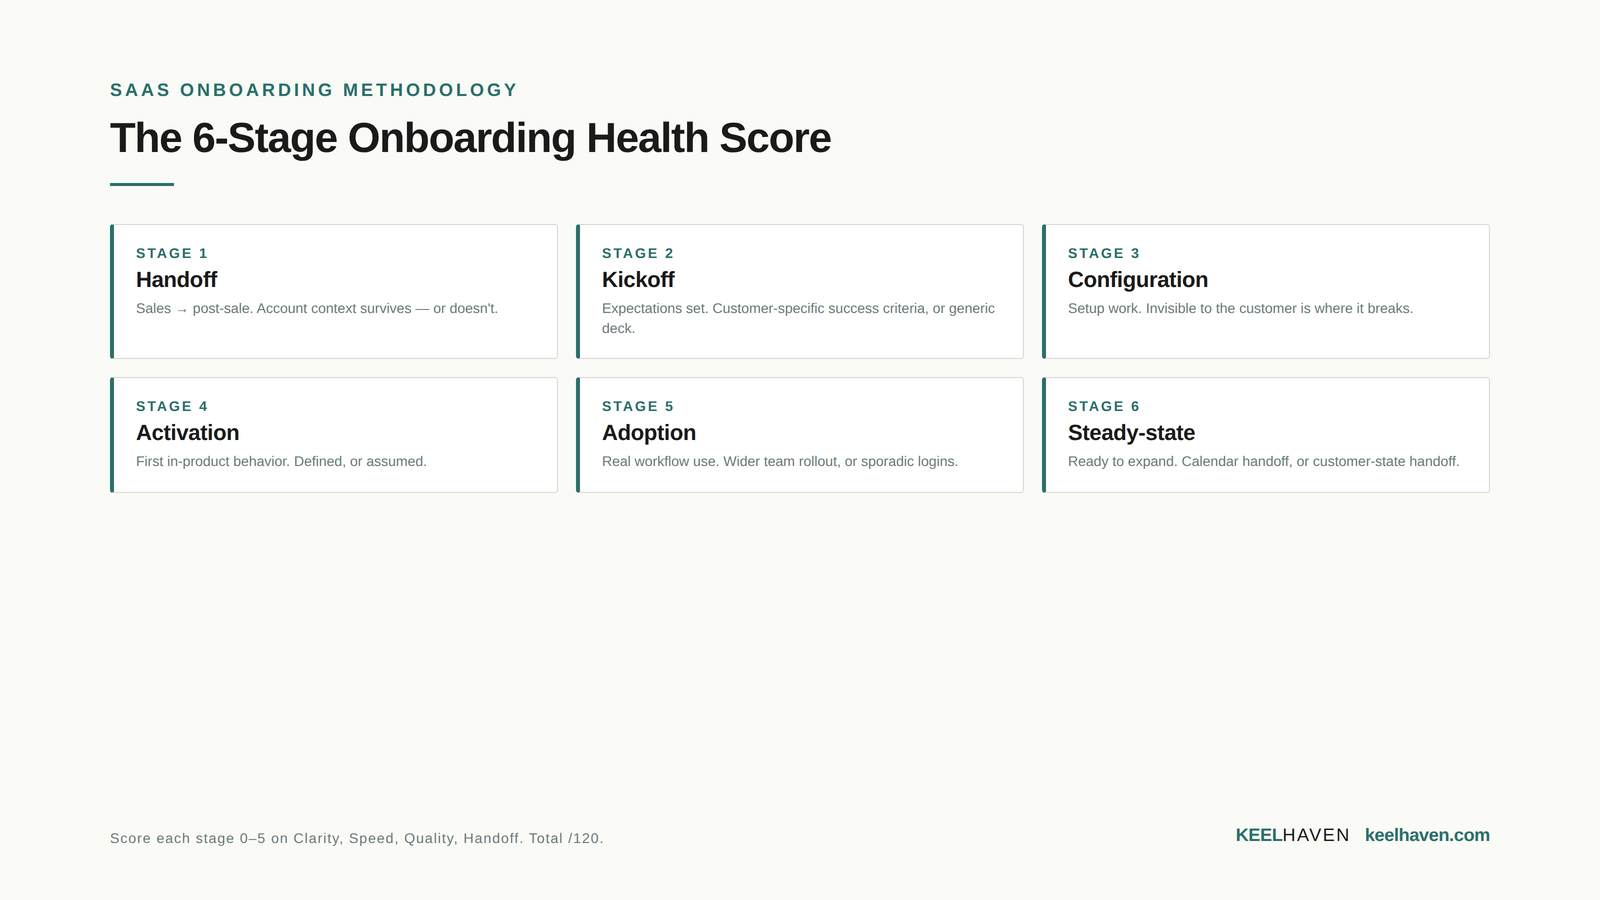
Every SaaS onboarding, however bespoke it looks, moves through the same six stages. Naming them is the first step to running them as an operation rather than a fog.
Stage 1 — Handoff. Sales transitions the customer to the post-sale team. This stage typically breaks when the promises Sales made are lost in translation and the account record contains a contract value and some contact names but nothing about the customer's decision driver, their champion, or what specifically they were sold.
Stage 2 — Kickoff. The first post-sale meeting, where expectations and timelines are set. It breaks when the kickoff is generic — the same deck for every customer, a logo on slide one — and no customer-specific success criteria get defined for the 30, 60, and 90-day marks.
Stage 3 — Configuration. The account, roles, integrations, and data get set up. It breaks when the work is manual, error-prone, and — critically — invisible to the customer, who sends a data file and then waits in silence.
Stage 4 — Activation. The customer completes the in-product behaviors that signal value. It breaks when nobody has defined what "activated" actually means, so different team members use different definitions and the customer is told "you're live" without feeling any different than yesterday.
Stage 5 — Adoption. The customer begins using the product in their actual workflow. It breaks when usage stays sporadic, the rollout to the wider team stalls, and adoption never deepens.
Stage 6 — Steady-state. The customer is in production and ready to expand. It breaks when the handoff to Account Management happens on a calendar date rather than a customer state — and expansion conversations begin before the customer has actually succeeded.
Scoring each stage
Each stage is scored 0–5 on four dimensions. Twenty points per stage, 120 total.
Clarity asks whether everyone — customer and internal team — knows what is supposed to happen at this stage, when, and why. A 0 means no documented expectations exist. A 5 means the customer arrives at the stage with the same understanding the internal team has.
Speed asks whether the stage completes in a target time without unnecessary friction. A 0 means no target time exists at all. A 5 means the target is hit more than 90% of the time and cycle time is a managed metric.
Quality asks whether, when the stage completes, its output is reliable enough for the next stage to start cleanly without rework. A 0 means quality is incidental and depends entirely on who ran the stage. A 5 means consistent output, measured and reported rather than assumed.
Handoff asks whether the next stage receives everything it needs to start cleanly. A 0 means handoffs are informal and lose context. A 5 means handoffs are structured, complete, and audited.
Score honestly. The most common scoring error is generosity — teams score the onboarding they intend to run, not the one they actually run. The number is only useful if it reflects reality.
What the score means
| Total score | Diagnosis |
|---|---|
| Below 40 | Crisis state — onboarding is the largest hidden source of churn |
| 40–60 | Functional but unreliable — quality depends on heroes |
| 60–80 | Working but not scaling — the process exists but does not compound |
| 80–95 | High-performing — most remaining pain is at scale boundaries |
| Above 95 | Best in class |
Two honest calibration points. The typical SaaS company in the $5–50M ARR range scores between 45 and 70 — most land in the high 50s. And in every operation we have assessed before engagement, we have not seen a score above 95. If you score yourself at 90, score again, harder. The first instinct is almost always too kind.
The dimension that is not in the score
There is a cross-cutting question the six-stage score does not capture, and it is the one that determines whether your score holds as you grow: if your most experienced person on a given stage left tomorrow, would that stage still run?
If the answer is no, the score is borrowed from individuals rather than built into the system. A 65 propped up by three irreplaceable people is more fragile than a 55 that runs on documented process. This is a leadership-level diagnostic rather than a stage-level one, which is why it sits outside the topline number — but it is the question to sit with after you have scored.
What to do with the number
The score is a starting point, not a grade. Three honest paths follow from it.
If you scored below 60 with structural problems — undefined stages, no measurement, no clear ownership — the issue is design, not effort, and the answer is a deliberate rebuild rather than more tooling or more hiring.
If you scored 60–80, the process exists but does not compound. Operational rigor and well-placed AI augmentation can absorb a meaningful share of the manual work and lift the score without a ground-up rebuild.
If you scored 80–95, the remaining pain is at scale boundaries, and the work is optimization — capacity engineering and data feedback loops.
Whichever bracket you land in, the value of the diagnostic is the same: it converts "our onboarding is broken" — a feeling you cannot act on — into "Stage 3 scores 8 out of 20 on Quality and Handoff" — a problem you can.
Questions
A printable version of the full scoring worksheet is in our SaaS onboarding playbook. If you would like to talk through what your score means for your specific situation, that conversation is hello@keelhaven.com — including the versions of it where the right answer is something you build internally.